Share This
A new study of 1,030 adults in Public Health Nutrition found widespread misunderstanding of whole grain labels among consumers. It is not surprising that the subjects of this study struggled to correctly quantify the whole grain content of foods, given that the authors failed to correctly utilize and take full advantage of the most valuable tool for quantifying whole grain content of food products: the Whole Grain Stamp.
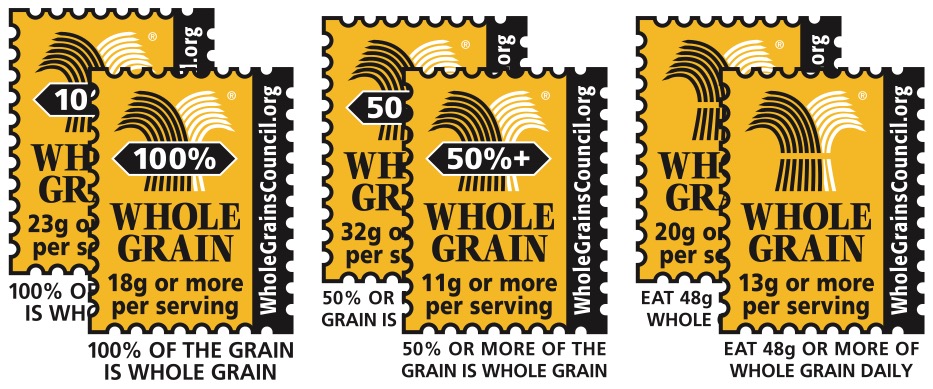
The Oldways Whole Grains Council has long recognized that marketing buzzwords are not reliable indicators of how much whole grain is in a product. This is precisely why the Oldways Whole Grains Council decided fifteen years ago to create the Whole Grain Stamp packaging symbol, which depicts the gram amount of whole grains in one serving of a product.
Today, the Stamp appears on more than 13,000 products in 63 countries around the world. The “level” of Whole Grain Stamp used also helps indicate the percentage of grain ingredients that are whole. For example, if a product bears the 100% Stamp, then all of its grain ingredients are whole grain. If a product bears the 50%+ Stamp, then at least half of its grain ingredients are whole grain.
In this misleading new study, the authors created hypothetical products in which all of the products with whole grain claims (such as the Whole Grain Stamp) had “nutritional disadvantages.” This hypothetical situation is not at all reflective of the products that carry the Whole Grain Stamp. Of the 10,700+ products registered for the Whole Grain Stamp in the U.S., 79% of them make at least half of their grains whole. This includes hundreds of products like steel cut oats, quinoa, and flours that don’t contain any “nutritional disadvantages” so to speak. Further, when the authors asked participants to quantify the amount of whole grains in various existing products, they did not show different Stamped products (such as the 50%+ Stamp and the 100% Stamp) and allow participants to compare between the two. Rather, the participants were sent on a goose chase across the front packaging, Nutrition Facts Panel, and ingredient listing, and were then asked to put the whole grain content into subjective categories such as “contains little to no whole grain.”
Unless both products bear the Whole Grain Stamp, asking consumers to compare the whole grain content of two mixed-ingredient products is near impossible, even for the savviest of consumers, because the information necessary for making that determination simply isn’t available. This is precisely the reason behind the creation of the Whole Grain Stamp – to truthfully report the whole grain gram amount, providing consumers with information that would otherwise be inaccessible to them.
Whole grains are a food group, not a nutrient, so there is currently no quick lab test that companies can run to quantify whole grain content, as they would with fat, calories, or something you’d find on the Nutrition Facts Panel. Determining the whole grain content of a product requires a clear understanding of what counts as a whole grain versus a refined grain (and what doesn’t count as a grain ingredient at all), along with information about the product’s formulation and nutritional profile. By providing this base level of whole grain knowledge and working with manufacturers to gather the formulation information required, the Oldways Whole Grains Council determines appropriate Whole Grain Stamp use accurately and consistently. This is why third party certification via the Whole Grain Stamp program has been particularly effective in communicating whole grain content with consumers. Data from the 2018 Whole Grain Consumer Insight Survey found that 51% of consumers are less likely to trust the product’s claims about whole grains without the Whole Grain Stamp.
When the Whole Grain Stamp is used as a tool in identifying whole grain products, consumer misunderstanding decreases drastically. In a census-representative survey conducted the same year as the Tufts data were collected looking at a significantly larger sample size (1,500), 62% of respondents correctly identified the meaning of the 100% Whole Grain Stamp, 65% correctly identified the meaning of the 50%+ Stamp, and 55% of respondents correctly identified the meaning of the Basic Stamp.
Whole grain intake falls well below recommended levels. USDA national survey data (NHANES) indicate that whole grains only account for 15.8% of total grain intake on any given day for adults, despite the Dietary Guidelines for Americans recommendation that consumers make at least half their grains whole. As strong advocates for increasing whole grain intake, the Oldways Whole Grains Council recognizes that partially whole grain products play an important role – especially for consumers who are new to whole grain foods – and can be great “bridge foods” as people move along their journey to better health. Rather than denigrating products that have some “nutritional disadvantages,” the Oldways Whole Grains Council advocates for the inclusion of whole grain ingredients in as many products and food categories as possible. Nutrition change is almost always incremental, and public health advocates and policy makers should be cautious not to let perfect be the enemy of good.
The authors of this new study suggest that future policies to address consumer confusion about whole grains might include the requirement that food manufacturers display the whole grain content as a percentage of the product’s total grain content and that they state the grams of whole grain and refined grain per serving. The Whole Grain Stamp, while not a mandatory part of package labeling, already communicates all of this except the grams of refined grain.


Add a Comment