Share This
How has the popularity of particular grains increased over the past several years? How has use and prevalence of the Whole Grain Stamp changed over time? Is the amount of whole grain in products increasing overall?
These are the types of questions we wanted to answer when we took a deep dive into the data stored in our Stamped Product Database. It’s been more than 15 years since we launched the Whole Grain Stamp and today our database is brimming with answers. Here’s a peek at what we found.
More Whole Grain in Products
As more and more consumers cite taste as a reason for preferring whole grains, it may come as no surprise that we’ve noticed an upward spiral in the whole grain content of foods appearing on grocery shelves.
Our 100% Stamp denotes products that make all their grain whole grain and contain at least 16g of whole grain per serving. A decade ago, 33% of all US Stamped products used the 100% Stamp and today that figure has risen to 40% of US Stamped products.
We have also seen an increase in the average whole grain gram amount that products contain. The whole grain gram amount per serving is clearly stated on each Whole Grain Stamp and in 2011, the average gram amount for all US Stamped products was 21g. Today the average has grown to 25g. Ten years ago, products using the 100% Stamp contained 32g of whole grain on average and today products using the 100% Stamp contain an average of 36g of whole grain per serving.
More Companies, Producing More Whole Grain Products
Interest in the Whole Grain Stamp has grown considerably as well. The number of companies who use the Whole Grain Stamp on their products has increased more than 50% in the last ten years. In 2011 there were about 250 Whole Grains Council member companies and today we are just shy of 400 members. In that time, the number of products that we have registered for Stamp use has far more than doubled. We currently have more than 13,000 Stamped products in our database, available in 63 countries, and new product registrations roll in every day.
Uncommon Grains Become More Common
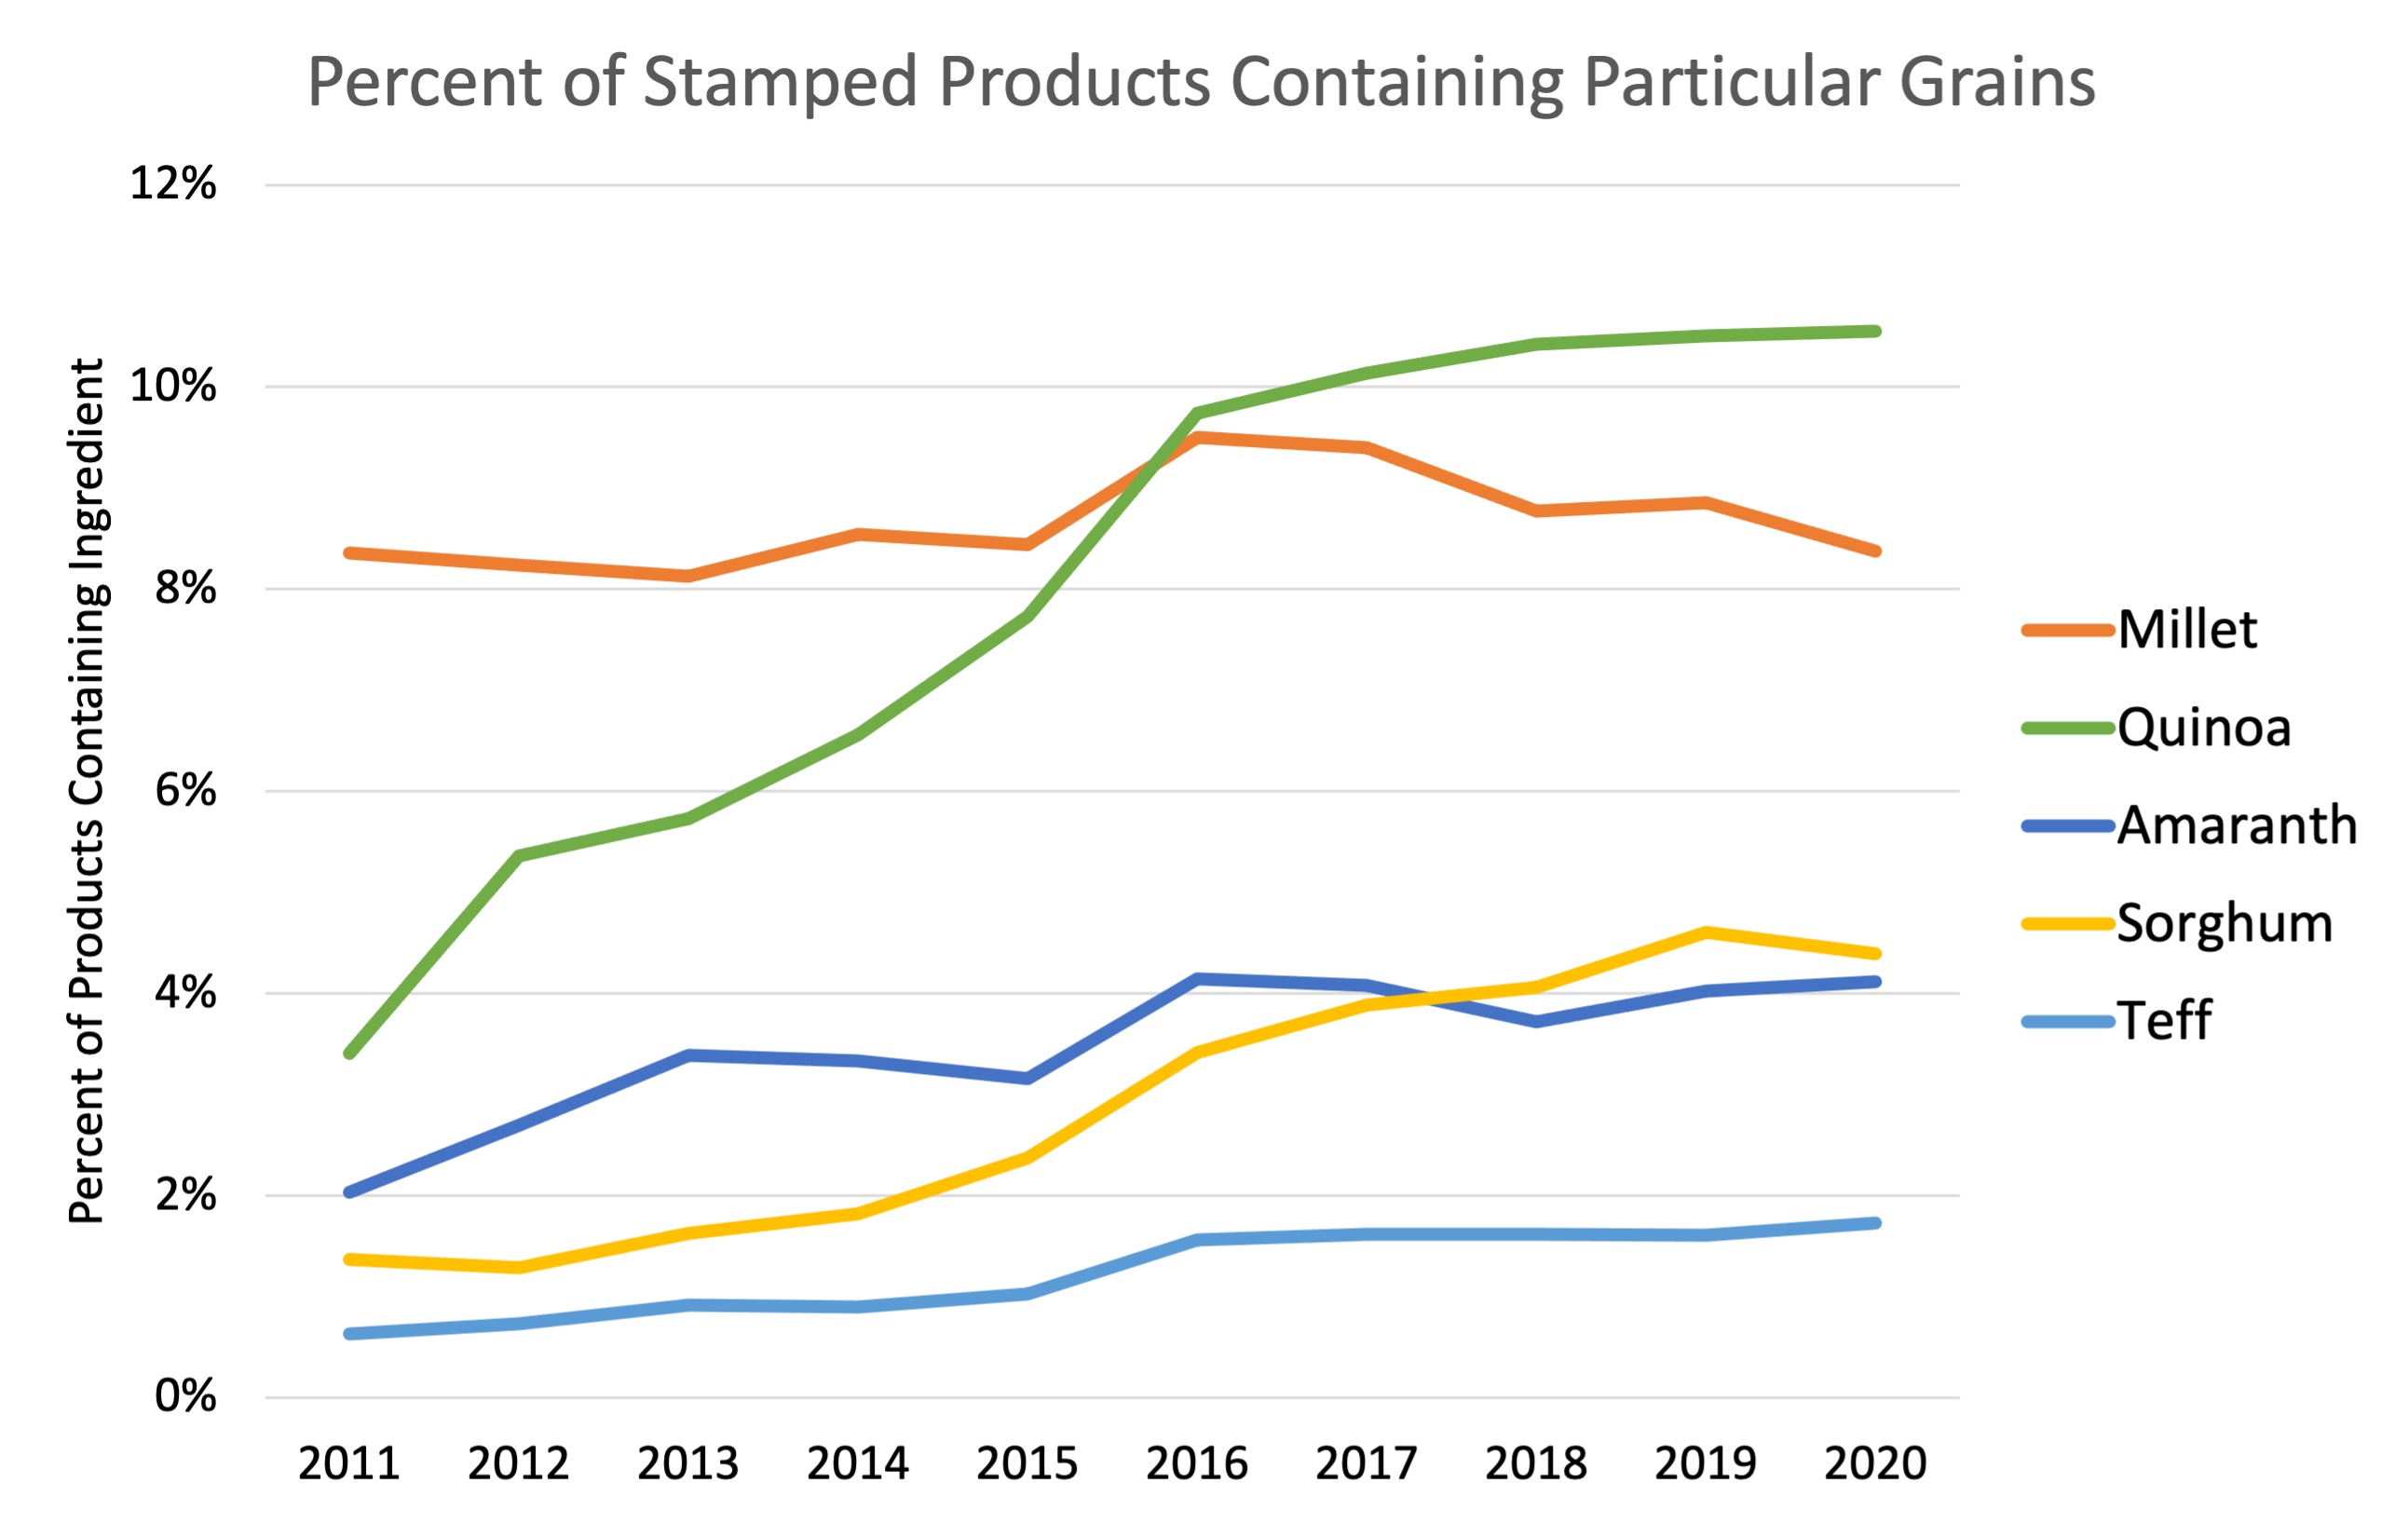
With a database that boasts thousands of products and ingredients lists, it’s relatively easy to keep our finger on the pulse of grain trends. Looking at the percent of products that contain particular ingredients is a great way to watch little-known grains emerge and catch on in the market.
Of the products registered for Stamp use over the past ten years, there are five clear frontrunners when it comes to growing popularity. Perhaps most illustrious of all is quinoa, which is now included in more than 10% of all Stamped products. Sorghum has also made impressive gains with its prevalence increasing more than threefold in ten years.
What questions do you have about the products in our database? Do you think millet or sorghum will rise to become the next quinoa in coming years? We’d love to hear your whole grain predictions and find out what questions you’d like our database to answer. (Caroline)


Comments
Add a Comment